Performance Dashboard · Anatomy

The Interactive Pareto,
Explained in 3D

Four features that turn the classic 80/20 principle into a hands-on analysis tool. Move your mouse — the dashboard tilts with you. Hover a number for a preview, click it to dive in.

$83.33MTOTAL AMOUNT
81%FROM JUST 6 STORES
12STORES RANKED
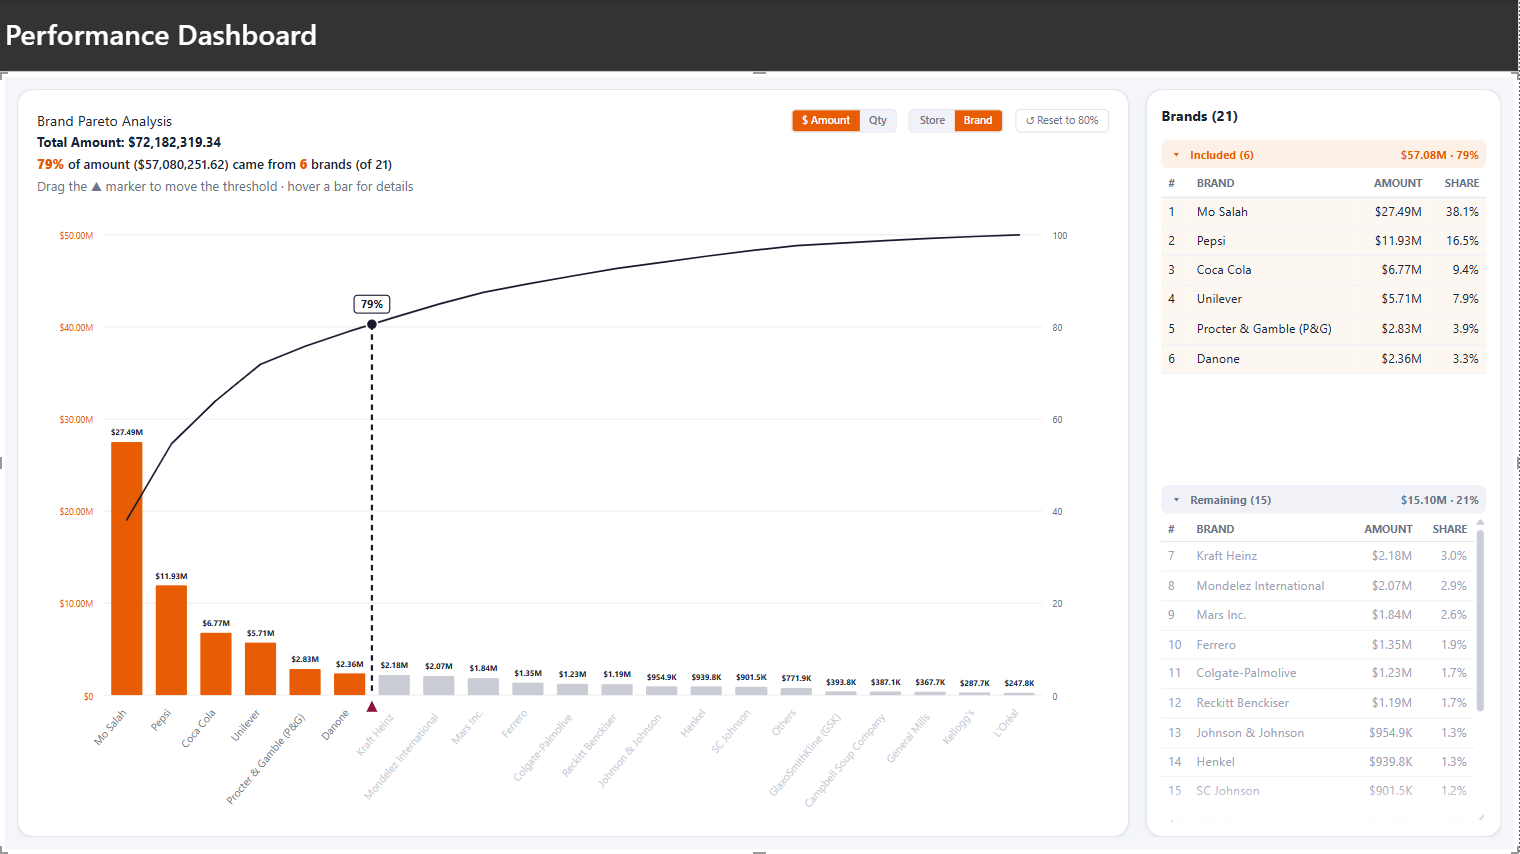
Brand Pareto Analysis dashboard
Scroll to explore
Feature 01

The headline
writes itself.

No hunting for the takeaway. The dashboard states the Pareto insight in plain language — "81% of amount ($67,180,000.00) came from 6 stores (of 12)" — and rewrites itself instantly whenever you move the threshold. The conclusion is always one glance away.

Store Pareto Analysis
Total Amount: $83,330,000.00
92% of amount ($76.73M) came from 9 stores (of 12)
▲ Live demo — the sentence re-types itself with new numbers every few seconds, exactly as it does when the cut-off moves.
Feature 02

Drag the cut-off.
Any split you want.

The 80/20 rule is a starting point, not a cage. Grab the ▲ marker and slide it along the curve — 70/30, 90/10, anything. Bars recolor, the headline recalculates, and the table re-splits in real time. Try it below — the demo is real.

$0.00M0$10.00M20$20.00M40$30.00M60$40.00M80$50.00M100 Mo Salah Amount: $27.49M Share: 33.0% · Cumulative: 33%Mo SalahPepsi Amount: $11.93M Share: 14.3% · Cumulative: 47%PepsiCoca Cola Amount: $6.77M Share: 8.1% · Cumulative: 55%Coca ColaUnilever Amount: $5.71M Share: 6.9% · Cumulative: 62%UnileverProcter & Gamble Amount: $2.83M Share: 3.4% · Cumulative: 66%Procter & GambleDanone Amount: $2.36M Share: 2.8% · Cumulative: 69%DanoneKraft Heinz Amount: $2.18M Share: 2.6% · Cumulative: 71%Kraft HeinzMondelez Amount: $2.07M Share: 2.5% · Cumulative: 74%MondelezMars Inc. Amount: $1.84M Share: 2.2% · Cumulative: 76%Mars Inc.Ferrero Amount: $1.35M Share: 1.6% · Cumulative: 77%FerreroColgate-Palm. Amount: $1.23M Share: 1.5% · Cumulative: 79%Colgate-Palm.Reckitt Amount: $1.19M Share: 1.4% · Cumulative: 80%ReckittJ&J Amount: $0.95M Share: 1.1% · Cumulative: 81%J&JHenkel Amount: $0.94M Share: 1.1% · Cumulative: 83%HenkelSC Johnson Amount: $0.90M Share: 1.1% · Cumulative: 84%SC Johnson 74%
▲ Drag the marker left / rightCut-off: 74%
Feature 03

One chart,
four lenses.

Toggle the metric — Amount / Qty — and the dimension — Store / Brand. One click re-ranks every bar, recomputes every share, and re-tells the story from a new angle. Flip the switches and watch the ranking change.

Feature 04

Every number,
behind the curve.

The matrix table lists every store with amount and share, auto-split into collapsible Included and Remaining groups. The split line follows your cut-off wherever you drag it — drag the marker in Feature 02 and watch this table move too.

▼ Included (8)$61.34M · 74%
#StoreAmountShare
1Mo Salah$27.49M33.0%
2Pepsi$11.93M14.3%
3Coca Cola$6.77M8.1%
4Unilever$5.71M6.9%
5Procter & Gamble$2.83M3.4%
6Danone$2.36M2.8%
7Kraft Heinz$2.18M2.6%
8Mondelez$2.07M2.5%
9Mars Inc.$1.84M2.2%
10Ferrero$1.35M1.6%
11Colgate-Palm.$1.23M1.5%
12Reckitt$1.19M1.4%
13J&J$0.95M1.1%
14Henkel$0.94M1.1%
15SC Johnson$0.90M1.1%
▼ Remaining (7)$21.99M · 26%
↔ Linked to the draggable cut-off above — currently 74%

The 80/20 rule,
now in your hands.

Stop reading static charts. Set your own threshold, switch your own lens, and let the dashboard state the conclusion for you.

Default ViewClassic 80/20 threshold — one click resets everything.
Instant FeedbackHeadline, bars and table update as you drag.
4 Views in 1Amount × Store · Amount × Brand · Qty × Store · Qty × Brand.